
Trade with precision.
Read the market.
Signal Stack is a multi-layer confluence indicator that translates price structure, momentum and volume into clear, actionable visual signals — right on your TradingView chart.
One-time purchase · Works on any ticker · Any timeframe
One overlay. Seven dimensions of confluence.
Most indicators tell you one thing and leave you to figure out the rest. Signal Stack layers seven technical dimensions into a single clean overlay that stays quiet until multiple conditions agree — fewer signals, higher conviction.
Built around Keltner Channel bands as the structural backbone, it adds momentum timing via Stochastic 8,3 — bull cross under 40 and bear cross above 60 — trend strength via ADX and DMI, volume confirmation, RSI with directional hook detection, and candle pattern recognition into a unified scoring system. Every signal has passed through all of those filters simultaneously.
Works on equities, ETFs, futures, crypto and forex on any TradingView timeframe — from 1-minute scalping to weekly swing trades. One copy-paste to install.
The deeper price moves into a zone, the higher the scoring weight assigned to any reversal signal that forms there.
Seven engines, one signal
Each layer earns its place. Together they decide whether a marker prints.
Keltner Channels · KC1 KC2 KC3
Three ATR-based envelopes around a 21-period EMA form the structural skeleton. They define how far price has stretched from center. The deeper the tag, the more statistically unusual the move — and the more powerful a potential reversal becomes.
EMA 21 · The Mean
The central gravity line. Markets consistently return to their mean. Pullbacks toward the 21 EMA with a confirming reversal candle fire as their own entry class — catching bounces that do not require a deep band tag.
Multi-EMA & SMA Stack
EMA 8, 21, 34, 89 plus SMA 50, 100, 200 paint the full trend picture. Their relative positions show whether momentum is expanding or contracting — and whether you are trading with or against the dominant trend.
Stochastic Oscillator · 8,3
A fast, responsive timing oscillator. Bullish crosses below 60 and bearish crosses above 40 prevent chasing exhausted moves and add precision to zone tags.
RSI + Hook Detection
A 14-period RSI with directional hook detection. RSI reversals from extreme zones often signal a momentum shift before price itself confirms. Oversold bounces from RSI 42 to 50 are specifically rewarded in the scoring.
Volume Confirmation
Tracks whether signal candles carry 1.3× average volume and adds it to the score. Separately marks the single highest-volume buy and sell candle in a rolling window with a directional arrow, so you always know where real conviction landed.
ADX & DMI Trend Strength
Determines whether the market is trending or ranging and adjusts scoring accordingly. A ranging market favors mean-reversion signals. A strong trend flags countertrend caution.
Every marker has a meaning
Signal Stack uses three distinct visual layers, each anchored precisely to its candle. Nothing floats in open space.
Light-Blue Dot below candle — BUY CALL Confluence
Appears when price tags a Keltner lower band or the EMA 21, a bullish candle structure forms, and multi-condition scoring passes the confidence threshold. Not a guarantee — a measured probability signal. The deeper the band, the higher the potential reward. Always check the broader trend before acting.
Yellow Dot above candle — SELL PUT Confluence
The mirror of the buy signal. Fires when price tags a Keltner upper band with a bearish candle and sufficient scoring. Useful for identifying exits on existing longs or entries for short and put plays. In a strong uptrend, upper-band tags often see shallow pullbacks rather than full reversals — context is everything.
Green Arrow Up below candle — Peak Buy-Side Volume
Marks the single candle in the rolling window that closed bullish with the highest volume. This is where buyers stepped in hardest. Use it as a reference for where demand may be anchored — not necessarily an entry on its own, but a meaningful structural point.
Red Arrow Down above candle — Peak Sell-Side Volume
Marks the bearish candle with peak volume in the window — where sellers dominated most aggressively. These bars often act as overhead resistance. Watch how price behaves when it returns to these levels.
White Hollow Circle at KC3 boundary — Neutral Potential Reversal Candle
The most specific signal on the chart. Only appears when price reaches KC3 — the outermost, most extreme band — AND the candle is a doji, hammer or shooting star. Price is at maximum stretch and the market is showing indecision or early rejection. This does not mean buy immediately. It means pay close attention. A confirming candle on the next bar significantly raises the probability of a meaningful move back toward the mean.
Red zone · KC2 → KC3
Statistical extreme. Most scoring weight. Extremes can extend — never size in fully at first touch.
Green zone · KC1 → KC2
Moderate extension. Common in trending markets. ADX context matters most here.
White zone · inside KC1
Near the mean. EMA 21 retest signals fire here. Lower drama, but statistically consistent.
Blue line · EMA 21
Gravitational center. Watch how price reacts — rejection or acceptance tells you the trend's health.
Seen on real charts — nothing drawn by hand
Every marker below was generated by the indicator's own rules on real daily bars. The outcomes are measured from the chart, not invented.
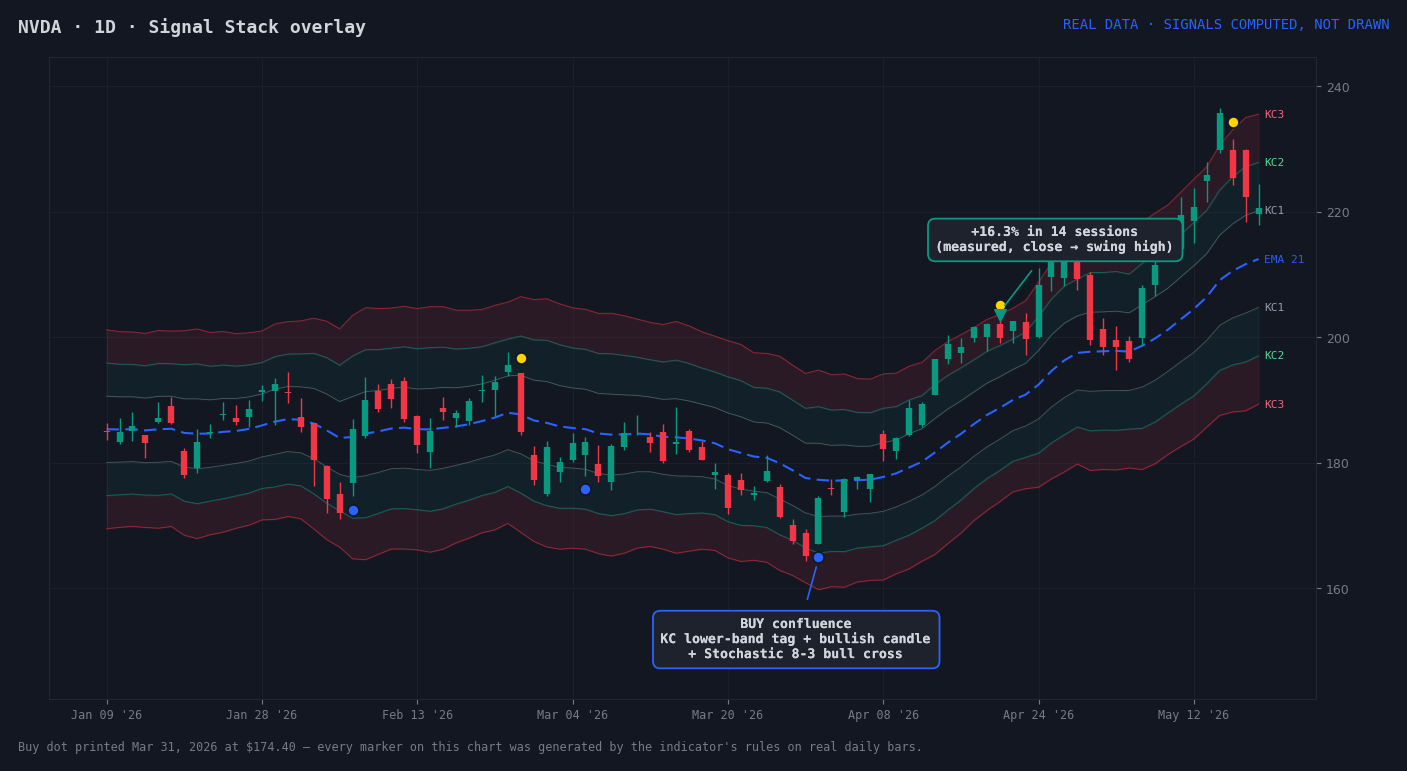
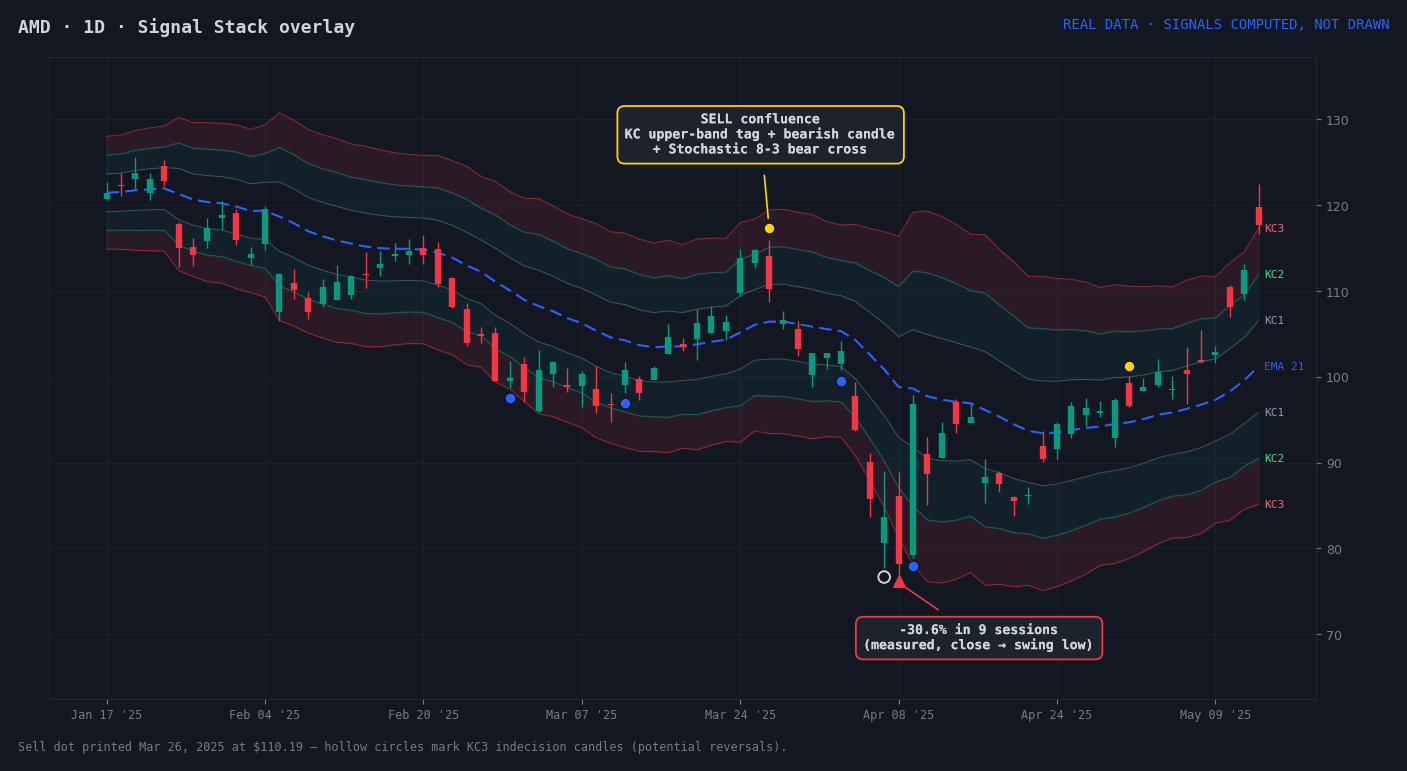
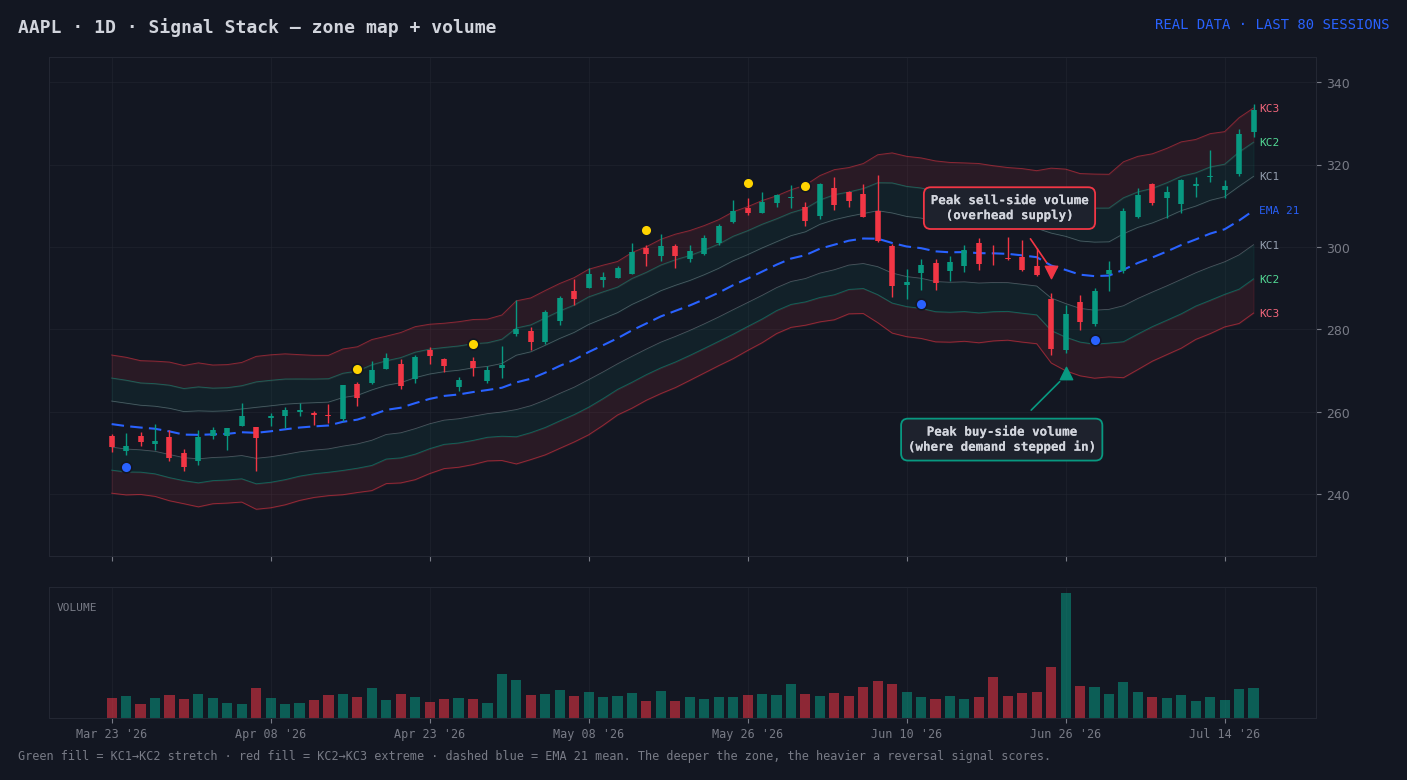
Historical, measured examples shown for illustration — not a promise of future results. Always do your own due diligence.
Signals inform. You decide.
Signal Stack does not predict the future. It quantifies probability and flags when multiple conditions align.
Treat signals as a starting point, not a verdict
A light-blue dot is the indicator saying the evidence here is worth examining. Your job is to agree or disagree based on what you see — price action, news context, sector momentum. The best trades often feel obvious when the signal appears. If something feels forced, it probably is.
The deeper the zone, the greater the opportunity — and the patience required
A KC3 tag with a reversal circle is a high-quality setup on paper. But high quality and right now are not the same thing. Wait for the next candle to confirm direction before committing. A confirmation close in the opposite direction is worth more than a signal alone.
Know the trend before you fight it
If the EMA 8 is far below the EMA 89 and ADX is above 30, the market is in a confirmed downtrend. Mean-reversion signals in that environment may produce short bounces, not full reversals. Fading a strong trend is the most common mistake new traders make. Signal Stack shows you the trend — take the time to look at it.
Volume arrows mark history, not entries
The green and red arrows identify where the most activity occurred in the recent window. These are reference points — potential support and resistance worth monitoring. Use them as context: did the peak buy-volume candle hold? Did price return to it and find support? That is the question worth asking.
No indicator replaces a stop loss
Every position taken on any Signal Stack signal should have a clearly defined stop loss before entry. The indicator includes a configurable ATR-based stop reference. Use it. Markets can do things no indicator anticipates — the traders who last are the ones who size appropriately and always define their risk before their reward.
Get Signal Stack
One simple price — or free with your Pro membership.
- ✓ Full Signal Stack Pine Script
- ✓ Email delivery with setup guide
- ✓ Works on any TradingView plan
- ✓ All tickers · all timeframes
- ✓ Indicator walkthrough included
- ✓ Signal reading reference guide
Delivered to your inbox within minutes of purchase.
- ★ Full Signal Stack Pine Script
- ★ Unlock directly on this page
- ★ Extended indicator documentation
- ★ All tickers · all timeframes
- ★ Priority access to future updates
- ★ All Pro member benefits included
Already a Pro? Enter your email to verify and unlock.